
Ask most people when Bitcoin was “cheap” and they’ll point to some vague memory of buying it for pizza money.
I went back and pulled the actual yearly low for Bitcoin, year by year, since 2012, and honestly, the pattern surprised me more than I expected. It’s not a straight climb. It’s not even a clean staircase. It’s a currency that spent 2015 falling below its 2014 floor, then spent 2026 falling below its 2025 floor too, and understanding why tells you almost everything about how this asset actually behaves.
The Full Yearly Low Comparison
Here’s the complete picture, year by year:
Laid out like this, the story isn’t really about the highs everyone remembers. It’s about the floors. And two of those floors stand out immediately as breaks in the pattern: 2015, which dipped below 2014’s low, and 2026, which has so far dipped well below 2025’s.
Why The Early Years Barely Register On A Chart
Looking at 2012 through 2014, it’s easy to forget these numbers represent real trading activity, not rounding errors. Bitcoin’s yearly low sat at just $4 in 2012, before climbing to a $13 floor in 2013 and a $300 floor in 2014. That 2014 number matters more than it looks, because it lines up with the year Bitcoin’s largest exchange at the time, Mt. Gox, collapsed after losing hundreds of thousands of bitcoins. The Tokyo court-appointed trustee overseeing that collapse is still processing creditor repayments over a decade later, and the ongoing case updates are published directly through the official MtGox Rehabilitation Trustee website. An exchange failure of that size, at a time when Bitcoin had almost no institutional infrastructure around it, is exactly the kind of shock that explains why the 2015 low fell to $190, actually beneath the 2014 floor, one of only two years in this entire dataset where that happens.
How 2017 Through 2019 Set The Stage For Institutional Bitcoin
The 2016 low of $360 and the 2017 low of $780 look modest next to what came after, but 2017 is the year Bitcoin genuinely entered mainstream financial infrastructure, with regulated futures contracts launching on major derivatives exchanges for the first time. That infrastructure shift didn’t stop the 2018 low from crashing to $3,200 as the broader crypto market corrected hard off its late-2017 highs. What’s notable is that the 2019 low, at $3,400, barely moved from 2018’s floor, Bitcoin essentially spent two full years finding a bottom in the same narrow range before anything changed.
What Actually Broke Bitcoin’s Floor In 2020
The 2020 low of $3,800 is deceptive if you don’t know the context behind it. That floor was set in March 2020, during the same week the Federal Reserve made two emergency moves in rapid succession: cutting rates and expanding credit support for households and businesses as the economic shock from the coronavirus pandemic hit global markets. According to the Federal Reserve’s own March 2020 announcement, the central bank lowered its primary credit rate by 150 basis points and moved reserve requirements to zero percent, actions taken specifically to keep credit flowing during a period of extreme market stress. Bitcoin, along with nearly every other asset class, sold off hard during that same window before beginning the recovery that would eventually carry it to a $28,700 low by 2021, nearly 7.5 times higher than the year before.
Why 2024 And 2025 Mark A Genuine Turning Point
The jump from a $16,600 low in 2023 to a $39,400 low in 2024 lines up directly with one of the most significant regulatory shifts in Bitcoin’s history. On January 10, 2024, the US Securities and Exchange Commission approved the listing and trading of spot Bitcoin exchange-traded products on national securities exchanges for the first time. As the SEC’s own official statement on the approval put it, the decision marked the Commission’s approval of a series of proposed rule changes allowing bitcoin-based products to trade on regulated US exchanges, after more than a decade of previously rejected applications. That approval opened the door for a wave of institutional capital that had previously stayed on the sidelines, and it shows directly in the numbers, the 2025 low of $76,300 is more than four and a half times higher than the 2023 floor, the steepest two-year floor increase anywhere in this entire dataset.
What The 2026 Pullback Might Actually Signal
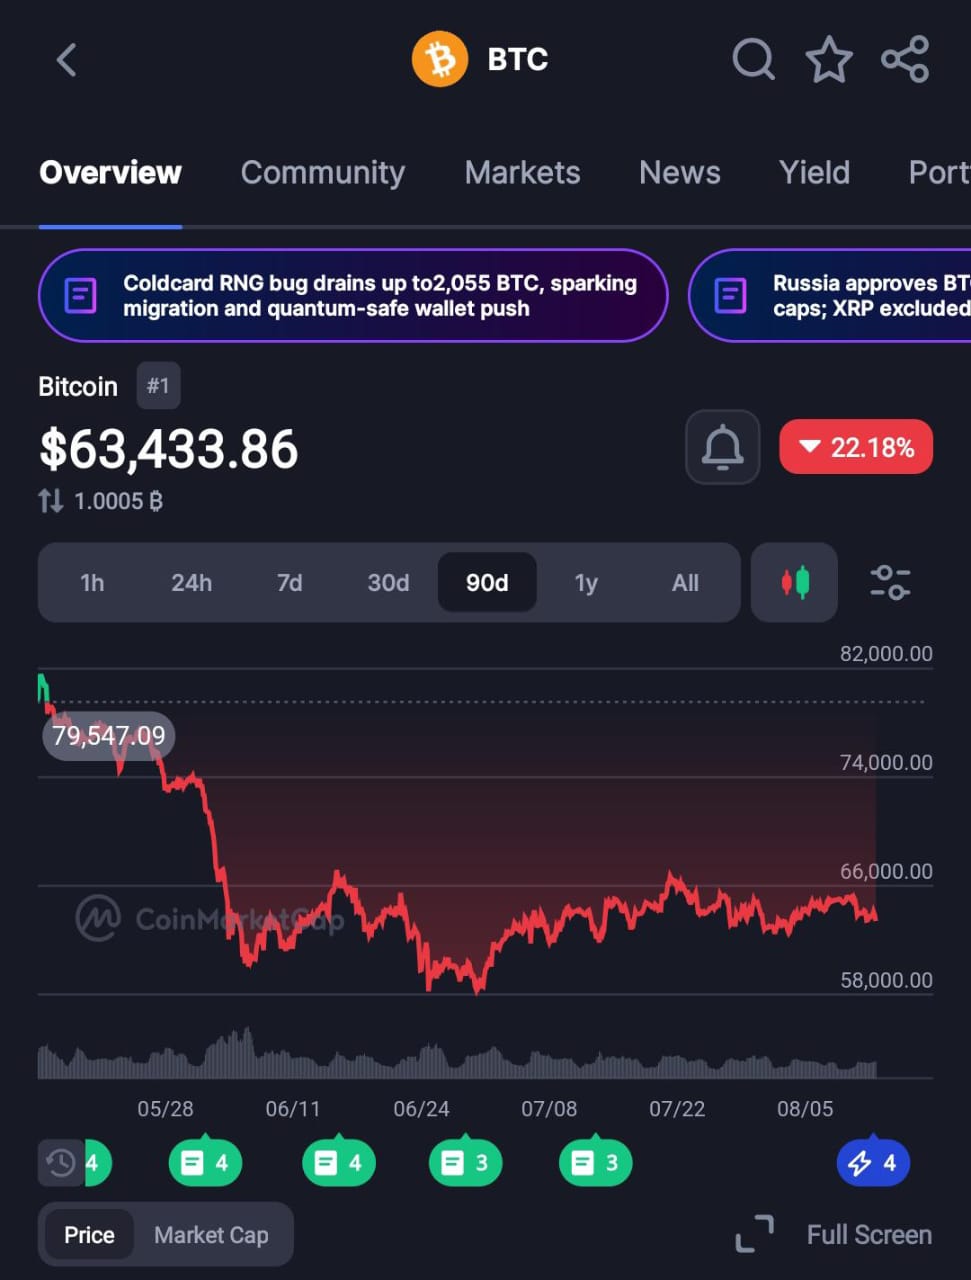
This is where the comparison gets genuinely interesting to me. After years of higher lows becoming the norm, 2026’s yearly low so far sits at $58,500, meaningfully below 2025’s $76,300 floor. That makes 2026 only the second year in fourteen where Bitcoin’s low fell beneath the prior year’s low, echoing what happened in 2015. But the context couldn’t be more different. In 2015, Bitcoin was an unregulated, thinly traded asset recovering from an exchange collapse. In 2026, it’s an asset with regulated spot ETFs, institutional custody infrastructure, and years of exchange-traded history behind it, which suggests this pullback reflects a market correction within a maturing asset class, rather than the kind of structural crisis that defined Bitcoin’s earliest years.
Whether $58,500 ends up looking like a healthy reset or the start of something longer is, honestly, not something any yearly-low chart can answer on its own. But looking at these fourteen years side by side, one thing is clear: every major break in Bitcoin’s pattern of higher lows has coincided with a real-world shock or a real-world regulatory shift, not random chance. That’s probably the most useful lesson buried in this entire comparison.
Disclosure: This is not trading or investment advice. Always do your research before buying any cryptocurrency or investing in any services.
Follow us on Twitter @themerklehash to stay updated with the latest Crypto, NFT, AI, Cybersecurity, and Metaverse news!